spatial_graph_algorithms
Unified toolkit for sequencing-based spatial microscopy graph analysis.
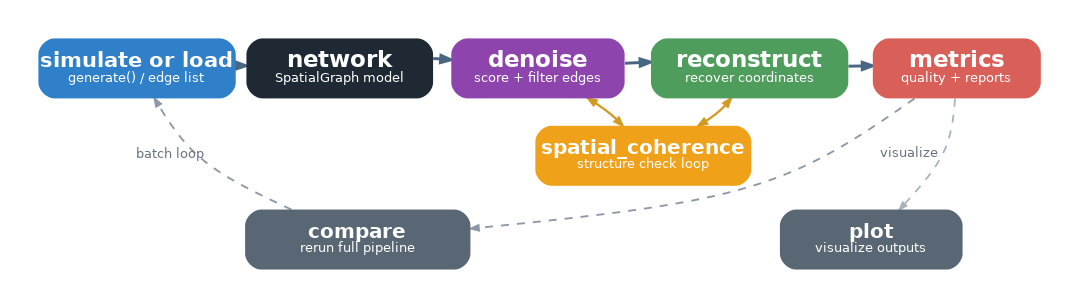
spatial_graph_algorithms provides a complete, well-tested analysis pipeline for proximity
graphs derived from spatial omics technologies (Slide-tags, Pixelgen, etc.).
🏆 See the live benchmark leaderboards →
Which denoiser + reconstructor wins on each dataset — and how much headroom is left to beat it.
| Step | Module | What it does |
|---|---|---|
| Simulate | spatial_graph_algorithms.simulate |
Generate synthetic spatial graphs with controlled noise |
| Reconstruct | spatial_graph_algorithms.reconstruct |
Recover node coordinates from graph topology |
| Denoise | spatial_graph_algorithms.denoise |
Score and remove likely false edges before reconstruction |
| Evaluate | spatial_graph_algorithms.metrics |
Score reconstruction quality (CPD, KNN, distortion) |
| Spatial coherence | spatial_graph_algorithms.spatial_coherence |
Check whether topology has low-dimensional spatial structure |
| Visualise | spatial_graph_algorithms.plot |
Plot graphs, histograms, and reconstruction comparisons |
| Report | spatial_graph_algorithms.verify |
Bundle all steps into a single run directory with CSV + PNG artefacts |
30-second example
from spatial_graph_algorithms.simulate import generate
from spatial_graph_algorithms.reconstruct import reconstruct
from spatial_graph_algorithms.metrics import evaluate

# Simulate a 500-node circle graph where 5% of final edges are false
sg = generate(n=500, mode="delaunay_corrected", false_edge_fraction=0.05, seed=42)

# Reconstruct coordinates from graph topology alone
sg_rec = reconstruct(sg, method="strnd", dim=2, seed=42)

# Score the reconstruction
print(evaluate(sg_rec))
# {'n_nodes': 500, 'cpd': 0.983, 'knn': 0.72, ...}
For a topology-only sanity check, use spatial_coherence.score(sg, dim=2).
It reports a spectral_score and per-eigenvalue variance contributions that
drop when random false edges flatten the graph's spatial spectrum.
Installation
Documentation Map
- New users: Installation, then Quickstart.
- Module docs: simulate, reconstruct, denoise, metrics, plot, compare, and verify.
- Collaboration: Developer guide for engineering expectations, task recipes, and the context map.
Citation
If you use spatial_graph_algorithms in your research, please cite:
[Paper citation — to be added on publication]